Debug your setup
Use built-in tools to troubleshoot issues in your K8sGateway setup.
K8sGateway is based on Envoy proxy. If you experience issues in your environment, such as policies that are not applied or traffic that is not routed correctly, in a lot of cases, these errors can be observed at the proxy. In this guide you learn how to use the K8sGateway and Envoy debugging tools to troubleshoot misconfigurations on the gateway.
Before you begin
If you have not done yet, install the glooctl CLI. The glooctl CLI is a convenient tool that helps you gather important information about your gateway proxy. To install the glooctl, you run the following command:
curl -sL https://run.solo.io/gloo/install | sh
export PATH=$HOME/.gloo/bin:$PATHglooctl that matches your installed version.
Debug your gateway setup
-
Check the K8sGateway installation. You can do that by using the
glooctl checkcommand that quickly checks the health of K8sGateway deployments, pods, and custom resources, and verifies Gloo resource configuration. Any issues that are found are reported back in the CLI output.glooctl checkExample output for a misconfigured VirtualHostOption:
Found rejected VirtualHostOption by 'gloo-system': gloo-system jwt (Reason: 2 errors occurred: * invalid virtual host [http~bookinfo_example] while processing plugin enterprise_warning: Could not load configuration for the following Enterprise features: [jwt] -
Get the details for the failed resource. For example to get the details of a VirtualHostOption, you can use the following command.
kubectl get virtualhostoption <name> -n <namespace> -
If the resources seem to be ok, you can check the configuration that is applied on your gateway. Configuration might be missing on the gateway or might be applied to the wrong route. For example, if you apply multiple RouteOption resources to the same route by using the
targetRefssection, only the oldest RouteOption is applied. The newer RouteOption configuration is ignored and not applied to the gateway.glooctl get proxy -o yaml -
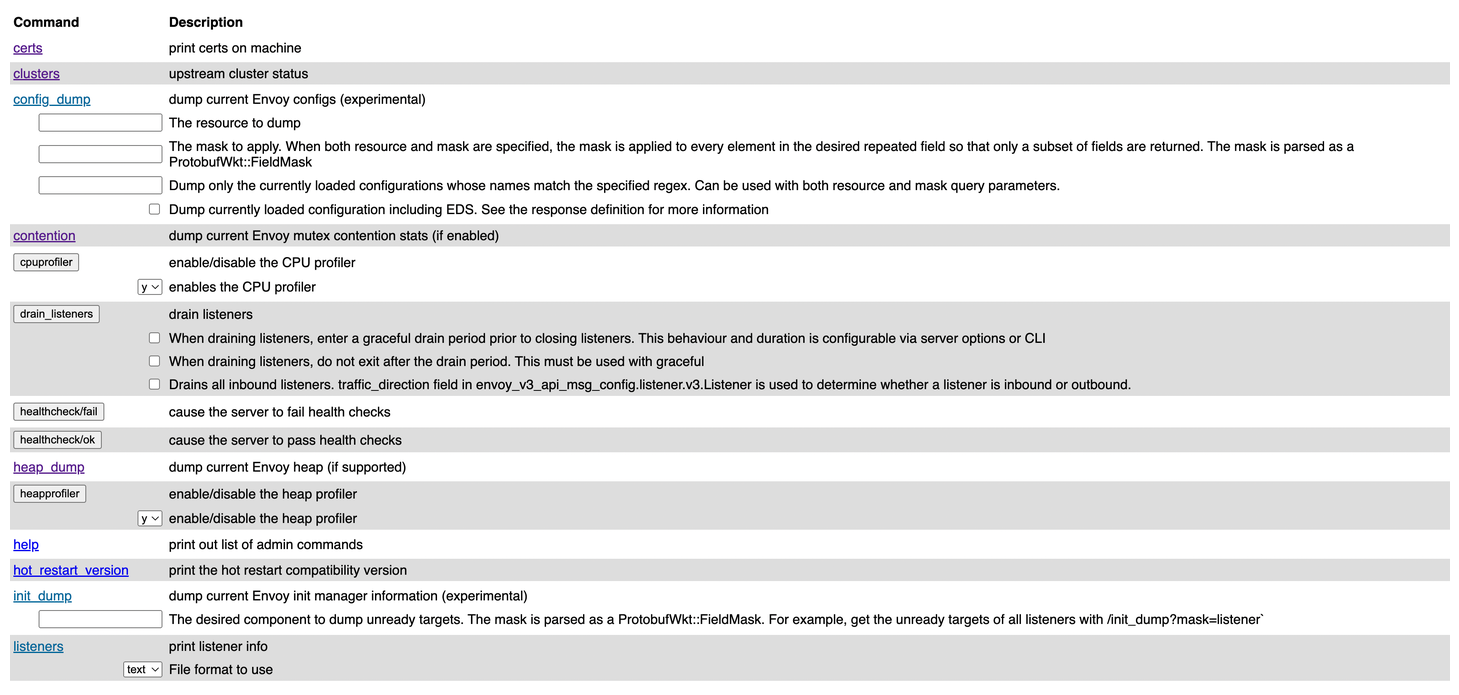
If the proxy resource seems to be ok, you can access the debugging interface of your gateway proxy on your localhost.
kubectl port-forward deploy/gloo-proxy-http -n gloo-system 19000 &
Figure: Debugging interface of the gateway proxy. Common endpoints that can help troubleshoot your setup further, include:
Endpoint Description config_dump Get the configuration that is available in the Envoy proxy. Any K8sGateway resources that you create are translated in to Envoy configuration. Depending on whether or not you enabled resource validation, you might have applied invalid configuration that is rejected Envoy. You can also use glooctl proxy dumpto get the Envoy proxy configuration.listeners See the listeners that are configured on your gateway. logging Review the log level that is set for each component. stats/prometheus View metrics that Envoy emitted and sent to the built-in Prometheus instance. -
Check the proxy configuration that is served by the K8sGateway xDS server. When you create K8sGateway resources, these resources are translated into Envoy configuration and sent to the xDS server. If K8sGateway resources are configured correctly, the configuration must be included in the proxy configuration that is served by the xDS server.
glooctl proxy served-config --name gloo-proxy-http -
Review the components of your K8sGateway setup. The number of components varies depending on whether you installed the Open source or Enterprise Edition of K8sGateway.
kubectl get pods -n gloo-systemExample output for open source:
NAME                                     READY   STATUS    RESTARTS   AGE
gloo-6bf6478bd8-rdghl                    1/1     Running   0          141m
gloo-proxy-http-77454f4df9-vchvf         2/2     Running   0          140m
redis-54757c7964-zxnb8                   1/1     Running   0          141m
Example output for Enterprise edition:
NAME READY STATUS RESTARTS AGE extauth-7f67b6bc68-2xsth 1/1 Running 0 141m gloo-6bf6478bd8-rdghl 1/1 Running 0 141m gloo-proxy-http-77454f4df9-vchvf 2/2 Running 0 140m rate-limit-5fc5fc9b8c-g4mfm 1/1 Running 0 141m redis-54757c7964-zxnb8 1/1 Running 0 141m -
Review the logs for each component. Each component logs the sync loops that it runs, such as syncing with various environment signals like the Kubernetes API. You can fetch the latest logs for all the components with the following command.
glooctl debug logs
# save the logs to a file
glooctl debug logs -f gloo.log
# only print errors
glooctl debug logs --errors-only
You can use the
kubectl logscommand to view logs for individual components.kubectl logs -f -n gloo-system -l gloo=glooTo follow the logs of other K8sGateway components, simply change the value of the
gloolabel as shown in the table below.Component Command Gloo control plane kubectl logs -f -n gloo-system -l gloo=glooGloo gateway proxy ℹ️To view logs for incoming requests to your gateway proxy, be sure to enable access logging first.kubectl logs -f -n gloo-system -l gloo=kube-gatewayRedis kubectl logs -f -n gloo-system -l gloo=redis -
If you still cannot troubleshoot the issue, capture the logs and the state of K8sGateway in a file.
glooctl debug logs -f gloo-logs.log
glooctl debug yaml -f gloo-yamls.yaml